Graph Visualisation Collection 2020
- Examples of Graph Visualisations 2020
- d3.js Examples
- Live Book d3.js in action
- Python Network Visualisation
- Graph Viz
- three.js
- Vis Example NetworkX + d3.js in Python
- Visualisierung vis.js
- Dagre-d3.js
- https://github.com/antvis/g6
- ElGrapho.js
- Graphdracula
- Python Dash Dash-Cytoscape
- VivaGraphJS
- Links
Examples of Graph Visualisations 2020
d3.js Examples
https://observablehq.com/@d3/gallery
https://observablehq.com/@mbostock/voronoi-stippling
- Observablehq Push the limits of data visualization
With 200,000+ community examples, Observable is the fastest way to build custom data visualizations, apps, and dashboards to uncover deeper insights.
https://observablehq.com/@d3/word-cloud
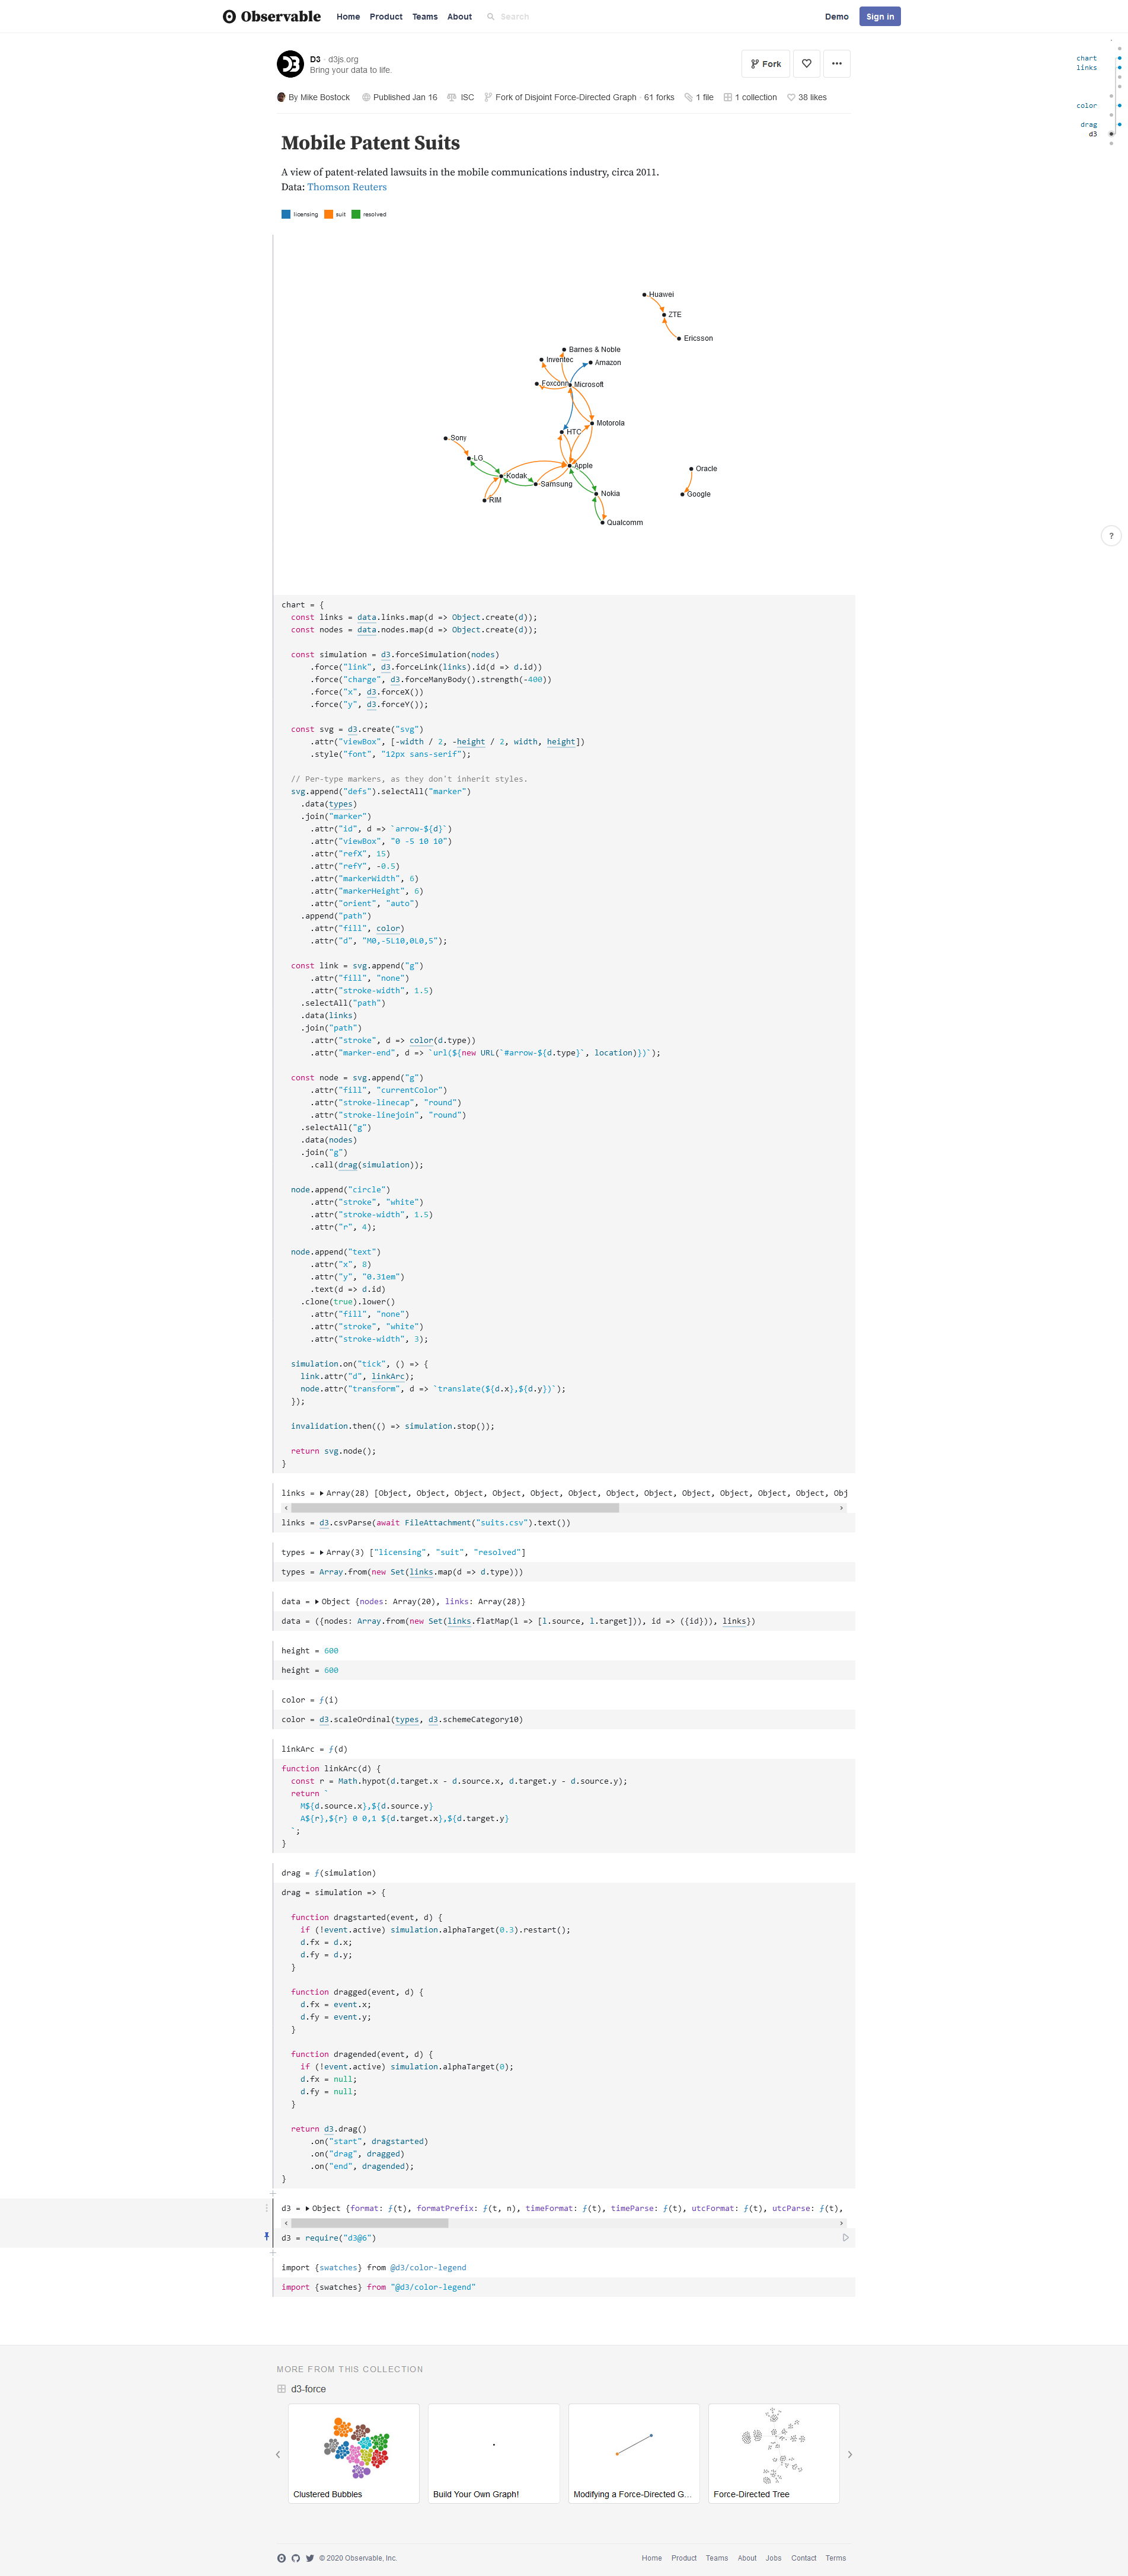
https://observablehq.com/@d3/mobile-patent-suits
Live Book d3.js in action
https://livebook.manning.com/book/d3js-in-action-second-edition/chapter-7/
Python Network Visualisation
NetworkX
NetworkX is a Python package for the creation, manipulation, and study of the structure, dynamics, and functions of complex networks.
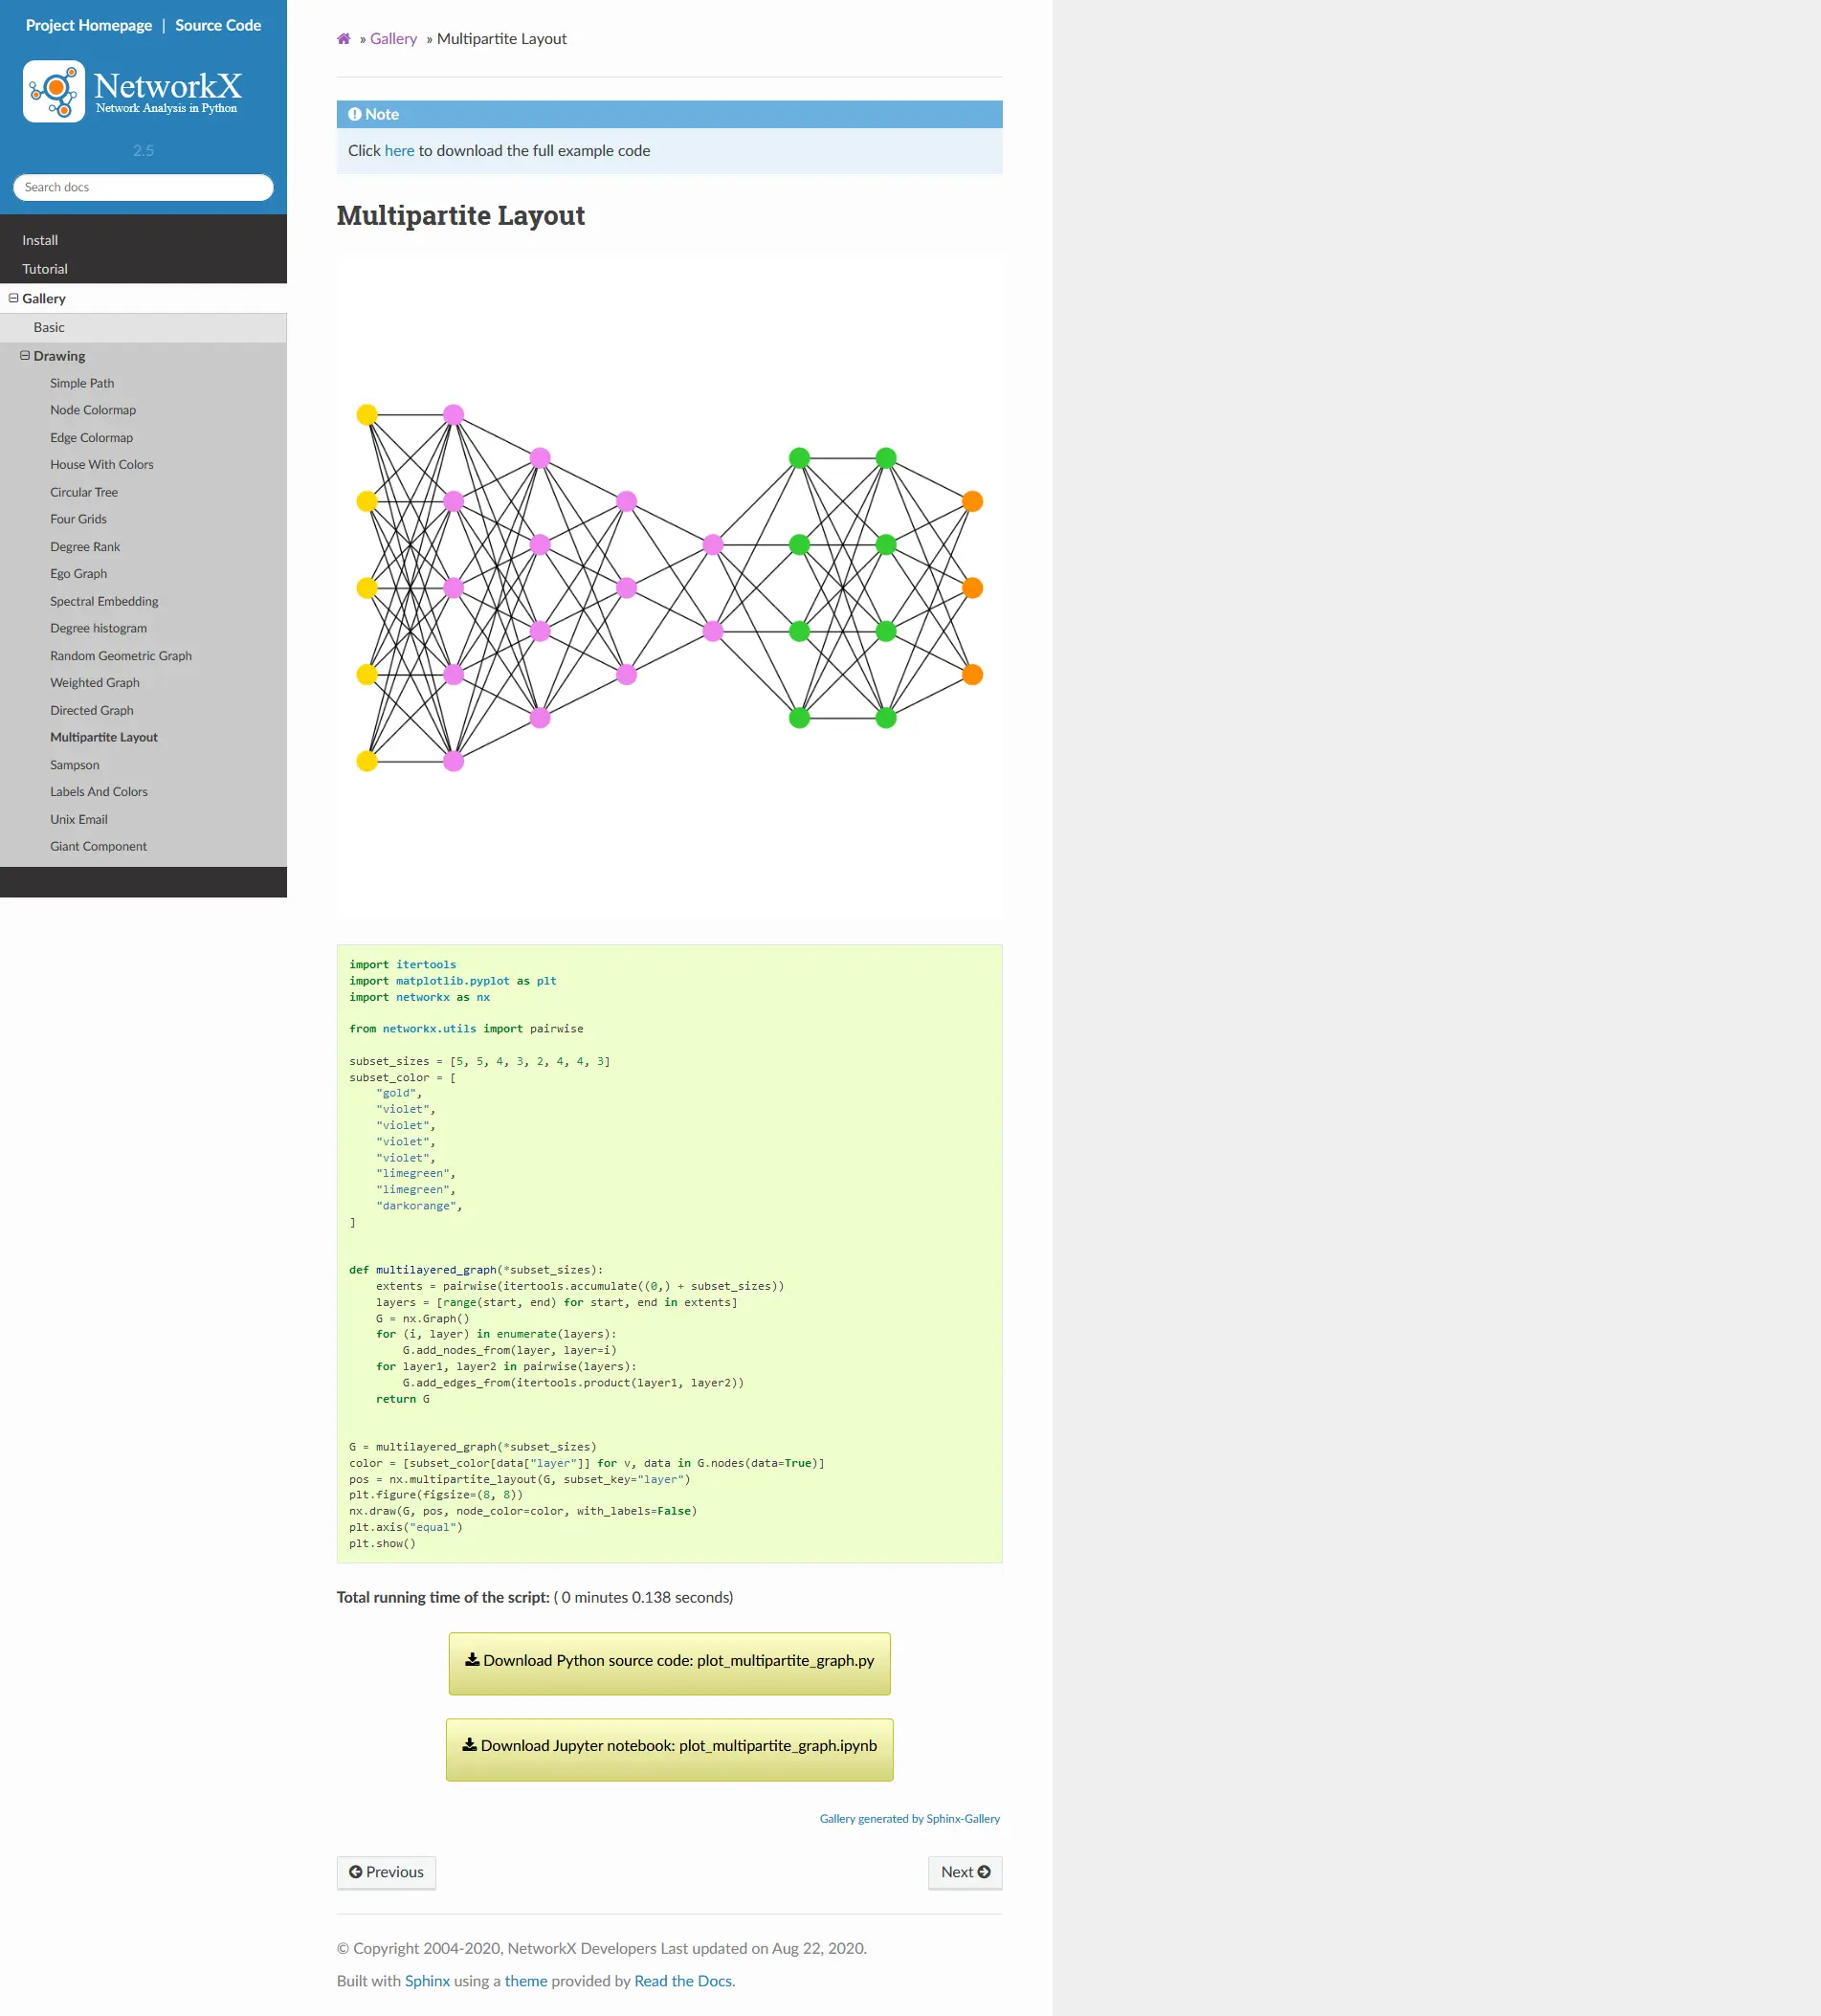
- Gallery
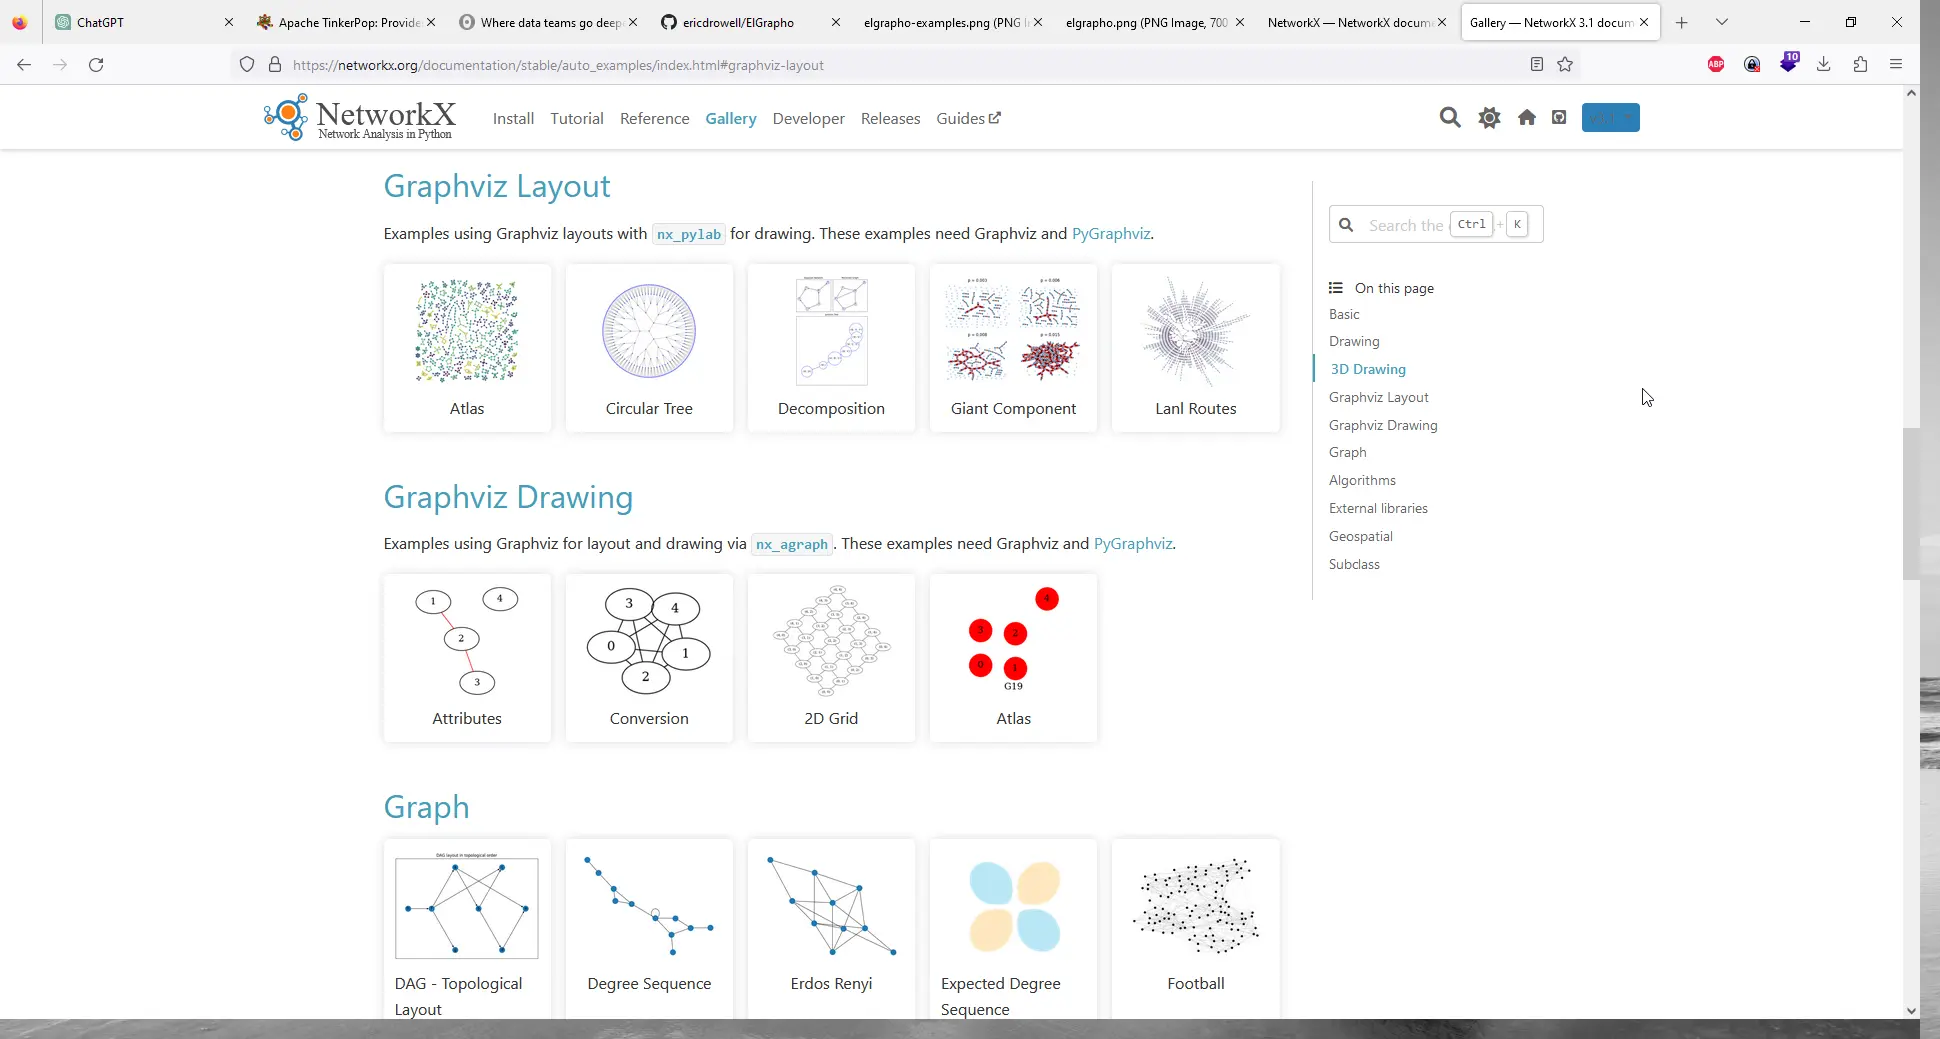
https://networkx.org/documentation/stable/auto_examples/index.html
JS addon for d3.js
https://github.com/networkx/networkx/tree/master/examples/javascript/force
Graph-Tool
python
- boost graph lib
Graph Viz
https://www.graphviz.org/gallery/
Examples of large Graphs
http://yifanhu.net/GALLERY/GRAPHS/index47.html
http://yifanhu.net/GALLERY/GRAPHS/search.html
three.js
examples tree.js
https://anvaka.github.io/pm/#/?_k=rn1q6d
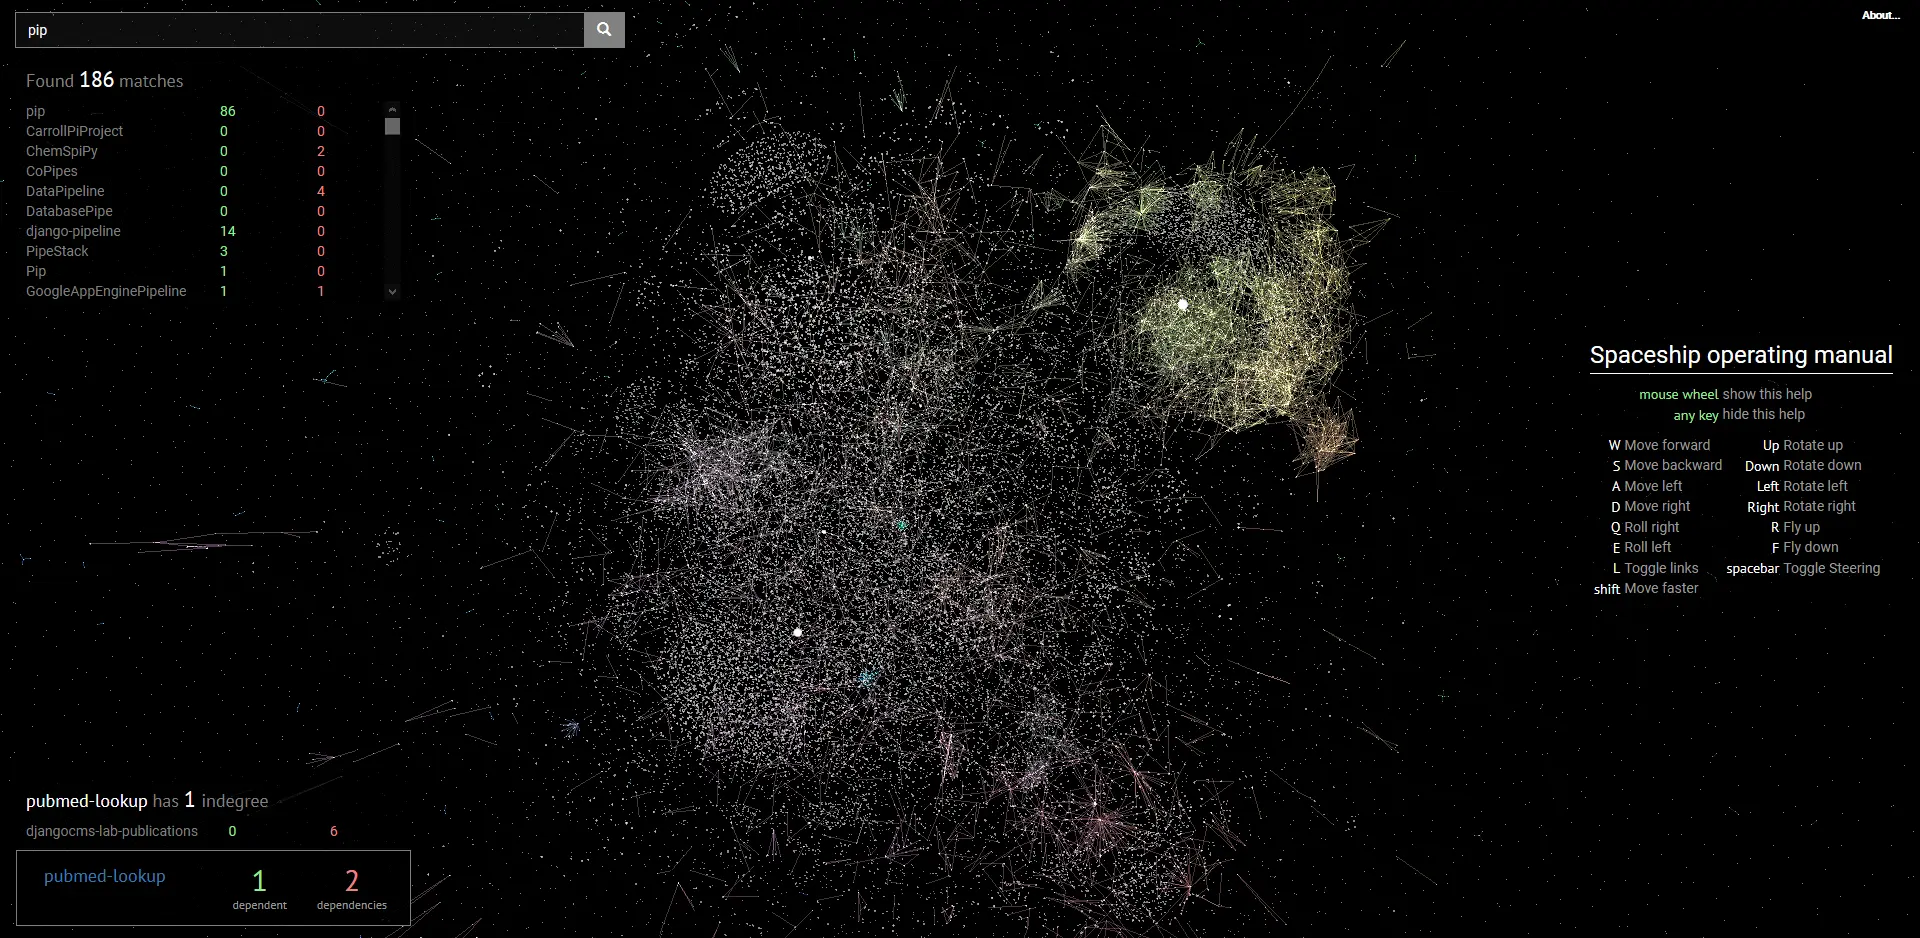
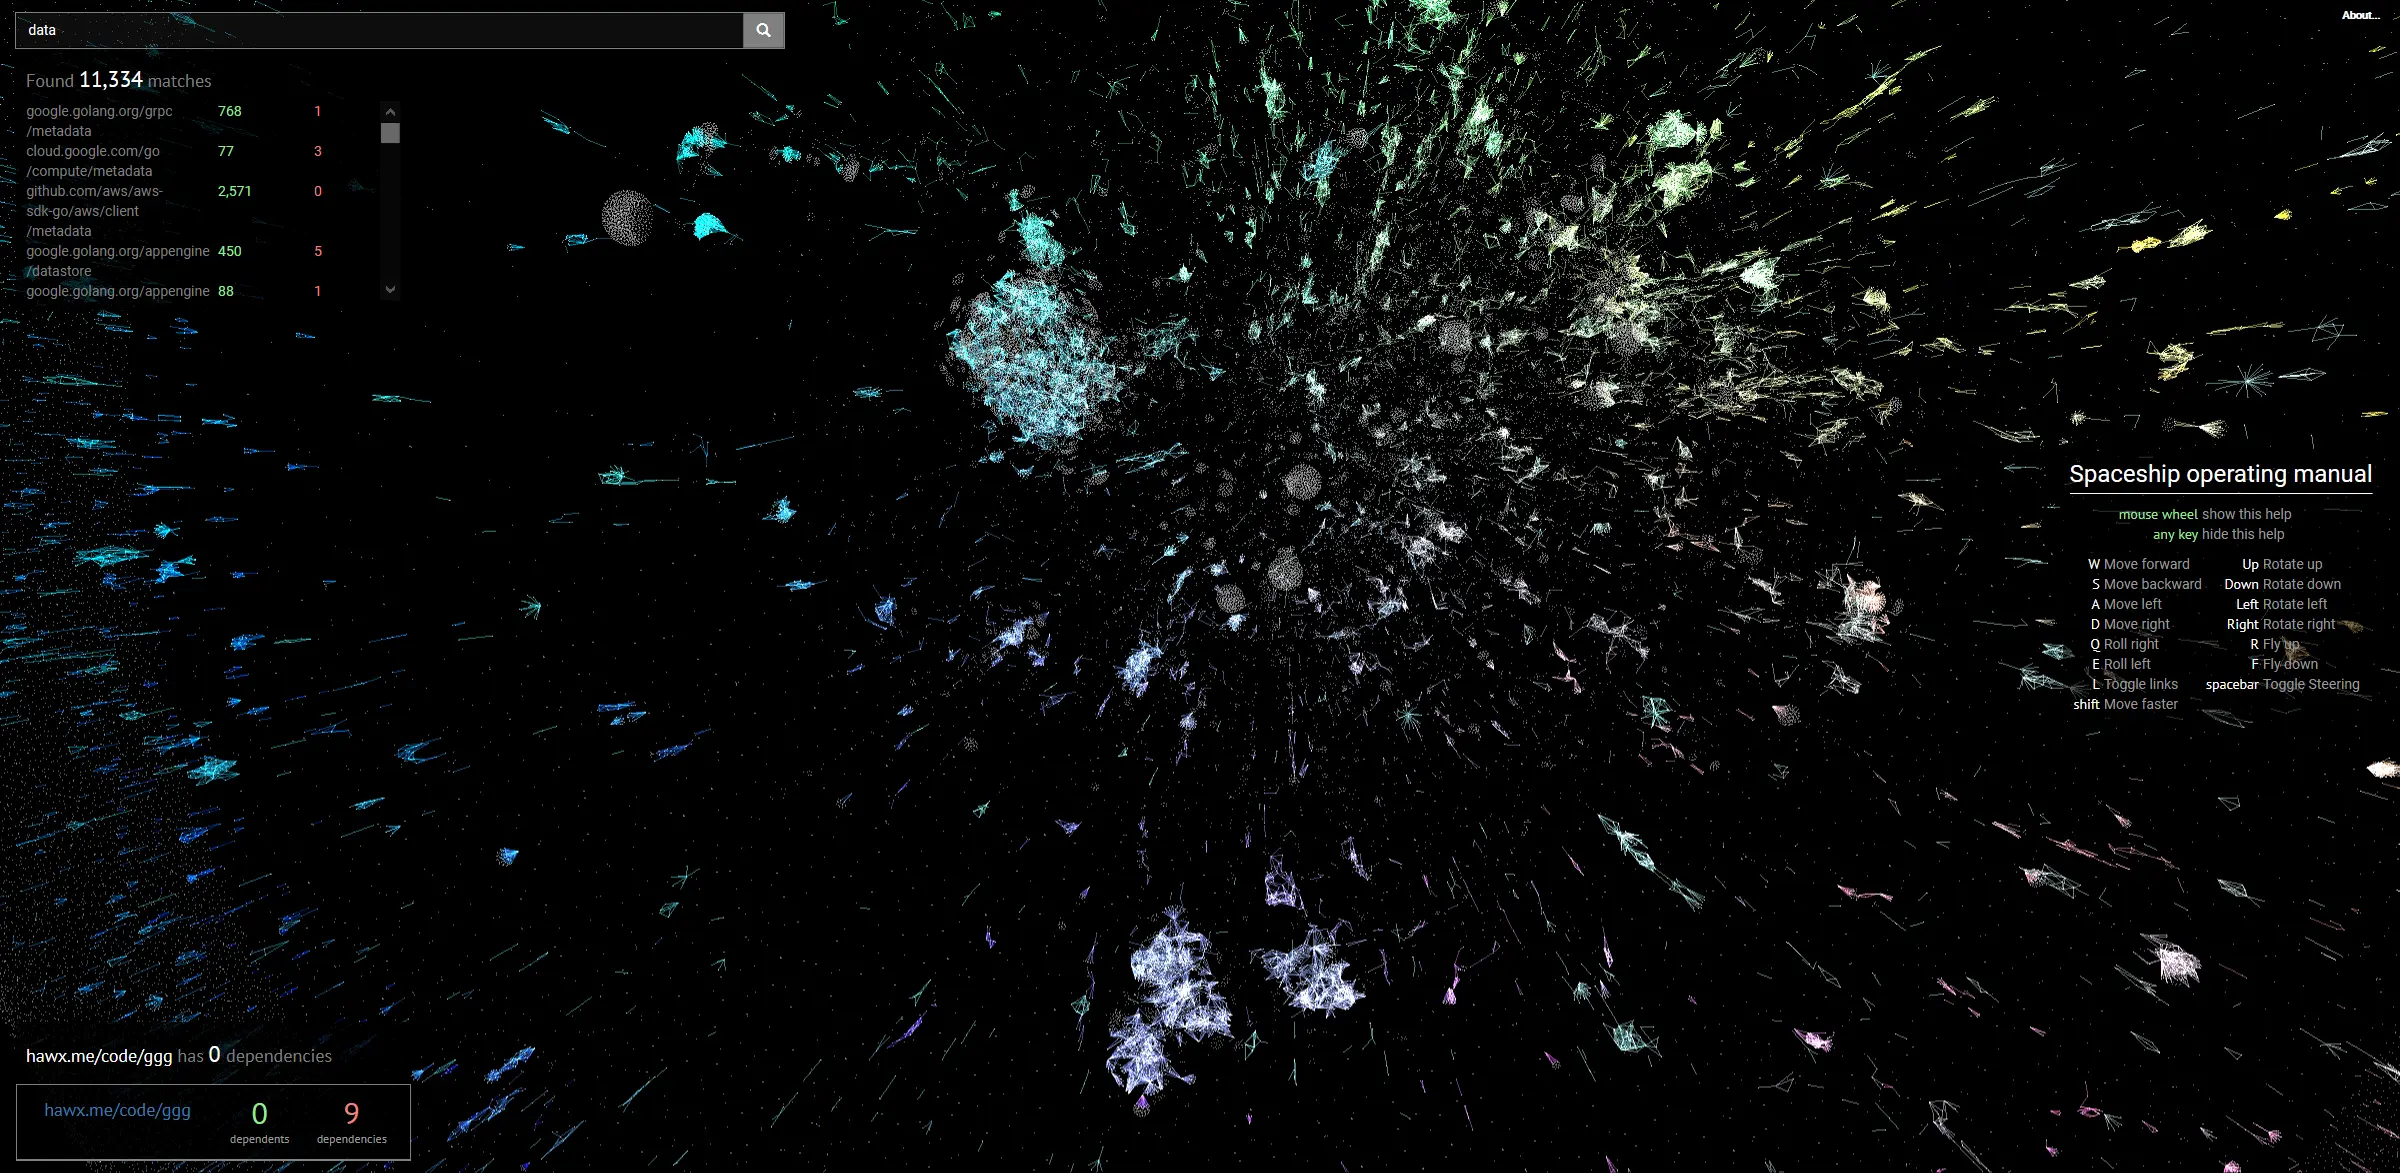
Vis Example NetworkX + d3.js in Python
-
Network of Trigrams and Bigrams: Generating Trigrams and Bigram via the NetworkX package.
-
Force-directed graphs with D3.js: Plotting dynamic visuals with D3.js
https://www.kaggle.com/arthurtok/ghastly-network-and-d3-js-force-directed-graphs
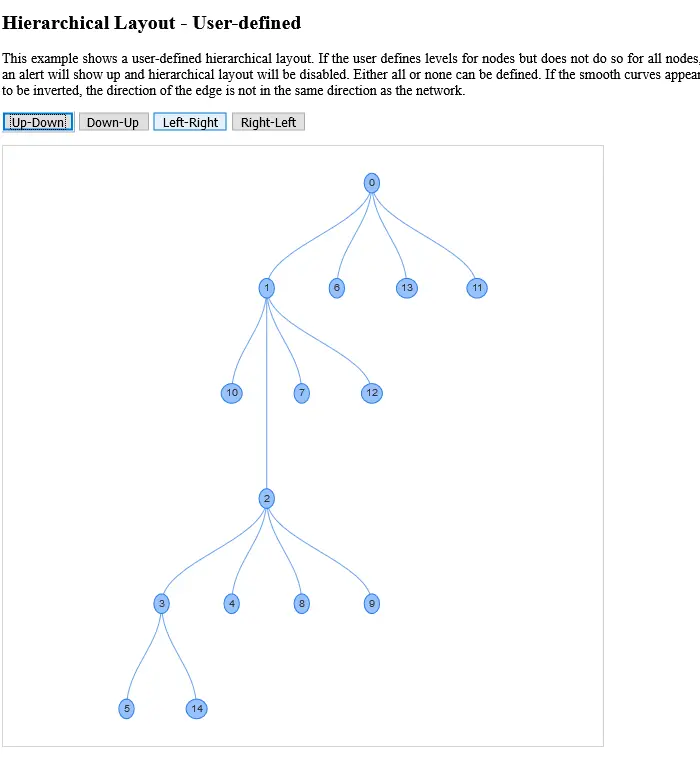
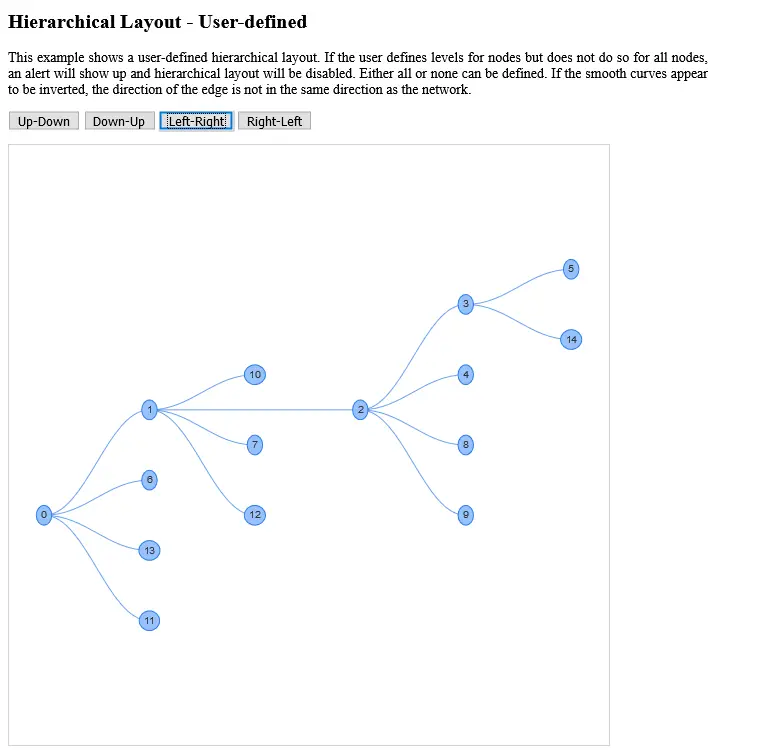
Visualisierung vis.js
Dynamic, browser based visualization libraries
https://visjs.github.io/vis-network/examples/
https://visjs.github.io/vis-network/examples/network/layout/hierarchicalLayoutUserdefined.html
Dagre-d3.js
https://github.com/dagrejs/dagre-d3
https://dagrejs.github.io/project/dagre-d3/latest/demo/etl-status.html
https://github.com/antvis/g6
https://antv-g6.gitee.io/en/docs/manual/middle/layout/graph-layout
ElGrapho.js
WebGL
https://github.com/ericdrowell/ElGrapho
https://codepen.io/ericdrowell/pen/wNRyoZ
Graphdracula
Python Dash Dash-Cytoscape
A Dash component library for creating interactive and customizable networks in Python, wrapped around Cytoscape.js.
https://github.com/plotly/dash-cytoscape
VivaGraphJS
https://github.com/anvaka/VivaGraphJS
Links
https://www.kdnuggets.com/2019/05/60-useful-graph-visualization-libraries.html