ELK Stack - Elasticsearch - Kibana - Logstash
 )
)
ElasticSearch, AWS — Open Distro Elasticsearch - OpenSearch
-
https://medium.com/@maxy_ermayank/tl-dr-aws-open-distro-elasticsearch-fc642f0e592a
) -
https://www.elastic.co/guide/en/elasticsearch/reference/7.9/docker.html
Raspi - ELK - Filebeat
install docker on Raspi (not working)
    sudo apt-get update && sudo apt-get upgrade

    sudo curl -fsSL https://get.docker.com | sh
    curl -fsSL https://get.docker.com -o - | sudo sh

    sudo reboot now

    sudo usermod -aG docker pi

    newgrp docker

    docker run hello-world

    sudo apt-get install -y libffi-dev libssl-dev

    sudo apt-get install -y python3 python3-pip

    sudo apt-get remove python-configparser

    sudo pip3 -v install docker-compose
uninstall Docker
sudo apt-get purge docker-ce
Delete Containers
sudo rm -rf /var/lib/docker
Install Docker ISO Raspi
https://blog.hypriot.com/post/releasing-HypriotOS-1-11/
Install Docker ELK - not working
    git clone https://github.com/deviantony/docker-elk.git

    cd /docker-elk

    # not working: ERROR: Service 'elasticsearch' failed to build: no matching manifest for linux/arm/v7 in the manifest list entries
    docker-compose up -d

    docker-compose ps
The Elasticsearch service should be accessible by accessing http://localhost:9200 using a HTTP client like Postman. Use auth to access it with elastic as the username and changeme as the password, and add application/json for Content-Type header.
The Kibana app should be accessible by accessing http://localhost:5601 using your favorite browser. When you got something like Kibana server is not ready yet on the browser, it means you really have to wait for the server to be ready. Just wait for about 10-15 minutes, then you can refresh the page and you will see the kibana login screen.
You can use the same elastic and changeme credential as username and password to enter.
he Logstash server should be accessible in http://localhost:5000 . I’m still new to ELK stack, so I will provide you example to use this service later or maybe on a specific blog post.
systemctl restart elasticsearch
Maual ELK Raspi - not working
sudo apt-get install default-jre

 sudo mkdir /usr/sh    are/elasticsearch
 cd /usr/share/elasticsearch
 wget https://packages.elastic.co/GPG-KEY-elasticsearch
 sudo apt-get install elasticsearch

sudo nano /etc/elasticsearch/elasticsearch.yml
network.host: 0.0.0.0
sudo service elasticsearch restart
neuer Versuch Install ELK (WORKING)
git clone https://github.com/stefanwalther/rpi-docker-elk.git

docker-compose up
Manual install Logstash
$ sudo apt-get install apt-transport-https
$ echo "deb https://artifacts.elastic.co/packages/5.x/apt stable main" | sudo tee -a /etc/apt/sources.list.d/elastic-5.x.list
$ sudo apt-get update
$ sudo apt-get install logstash
$ sudo service logstash start
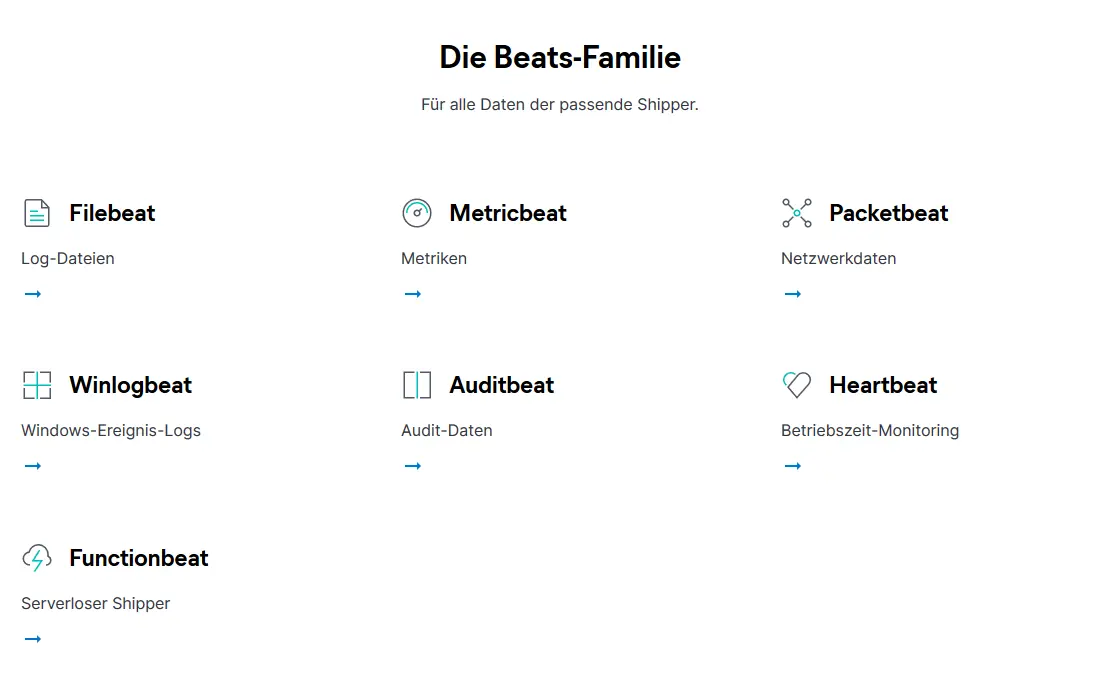
Beats
 )
)
MetricBeat
Collect metrics from your systems and services. From CPU to memory, Redis to NGINX, and much more, Metricbeat is a lightweight way to send system and service statistics.
https://www.elastic.co/beats/metricbeat
curl -L -O https://artifacts.elastic.co/downloads/beats/metricbeat/metricbeat-6.1.2-darwin-x86_64.tar.gz

tar xzvf metricbeat-6.1.2-darwin-x86_64.tar.gz
Configuration:
metricbeat.modules:
- module: system
  metricsets:
    - cpu
    - filesystem
    - memory
    - network
    - process
  enabled: true
  period: 10s
  processes: ['.*']
  cpu_ticks: false

fields:
  env: dev

output.elasticsearch:
  # Array of hosts to connect to.
  hosts: ["localhost:9200"]
Restart
sudo chown root metricbeat.yml
sudo chown root modules.d/system.yml
sudo ./metricbeat -e -c metricbeat.yml -d "publish"
Test
curl -XGET 'localhost:9200/_cat/indices?v&pretty'